An interactive knowledge graph that maps connections between notes, bookmarks, and ideas. Think of it as a visual second brain — every node is a thought, every edge is a relationship you define.
Traditional note-taking apps store information in lists and folders. But knowledge doesn't work that way — concepts connect to each other in non-linear, often surprising ways.
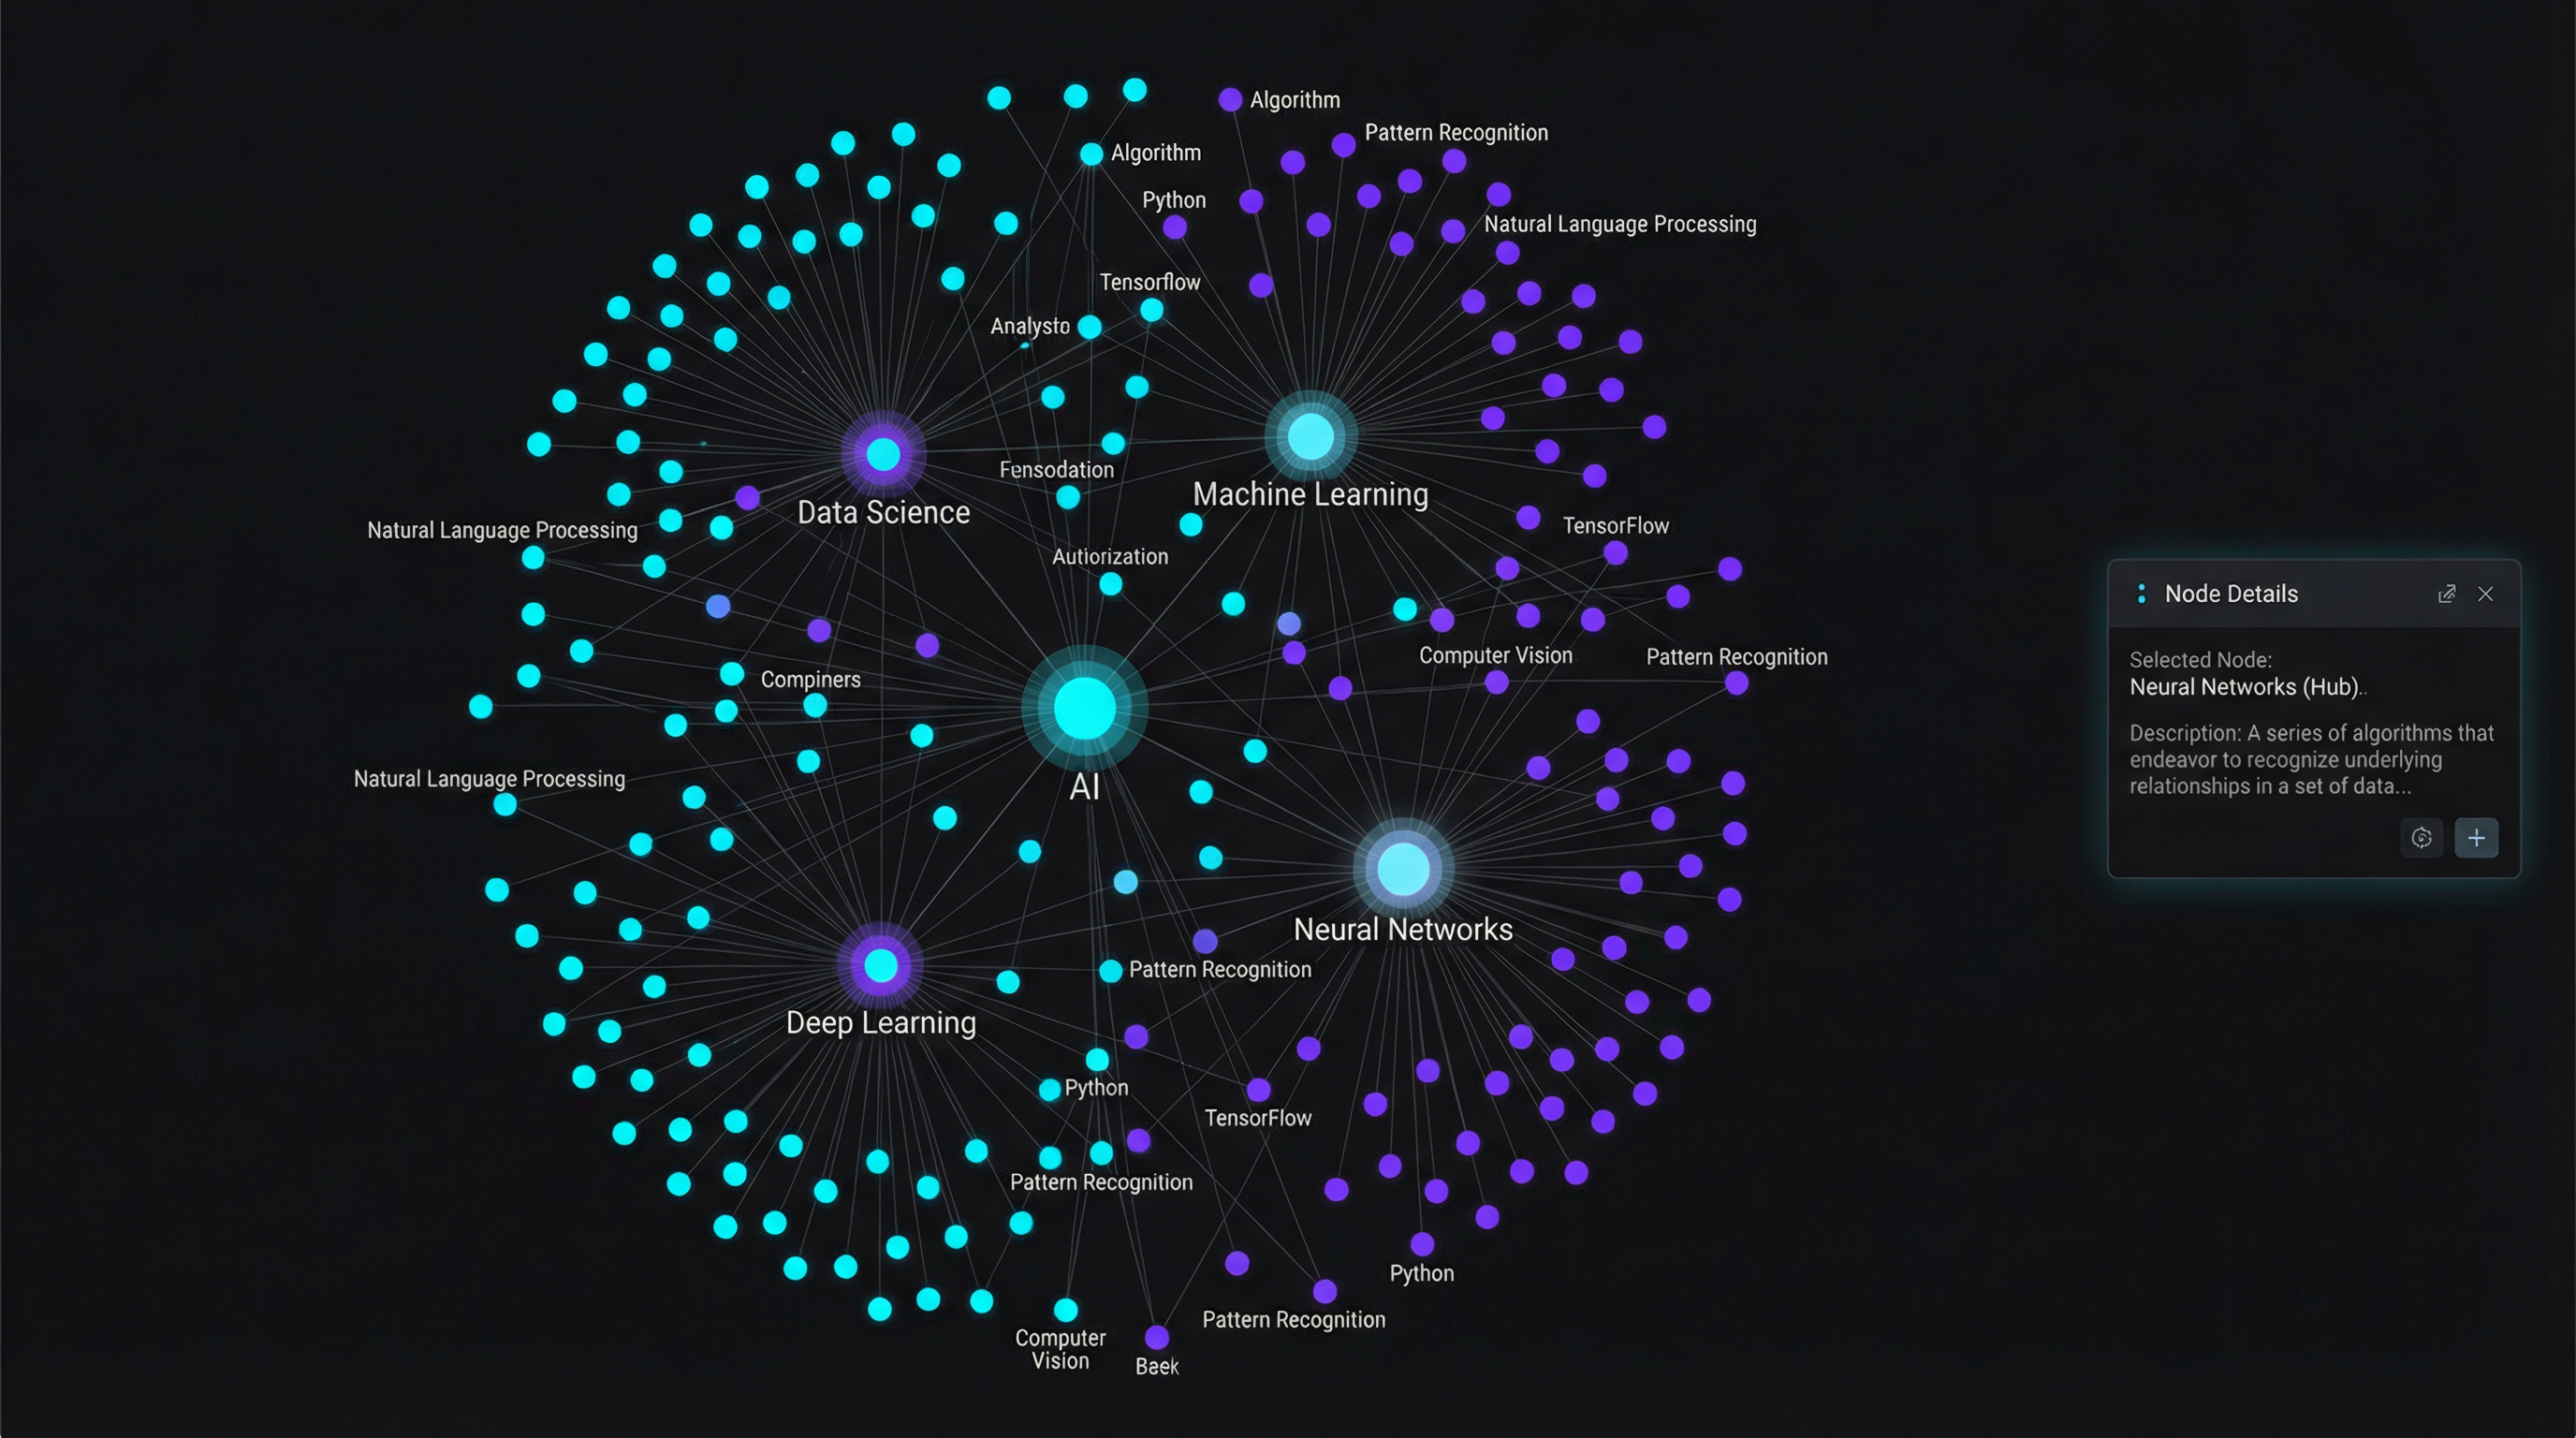
LinkGraph lets you see those connections visually. Add a note, link it to related topics, and watch your knowledge network grow into a navigable constellation of interconnected ideas.

The frontend renders an SVG-based force simulation using D3.js. Nodes repel each other while edges pull connected concepts closer. The backend stores graph data in SQLite and exposes CRUD operations through a FastAPI REST endpoint.
Nodes arrange themselves organically based on their connections and weights.
Find any node instantly. Results highlight matching clusters on the map.
Color-coded tags let you show or hide entire knowledge domains at once.
Discover shortest paths between any two concepts in your graph.
View your graph at any point in time. See how your thinking evolved.
Export your entire graph as JSON for backup, migration, or analysis.
Rearrange nodes manually. Pinned positions persist across sessions.
Each node contains a rich Markdown editor. Your graph, your docs.
import * as d3 from 'd3';

export function createGraph(container, { nodes, edges }) {
  const width  = container.clientWidth;
  const height = container.clientHeight;

  const svg = d3.select(container)
    .append('svg')
    .attr('viewBox', [0, 0, width, height]);

  const simulation = d3.forceSimulation(nodes)
    .force('link', d3.forceLink(edges)
      .id(d => d.id).distance(120))
    .force('charge', d3.forceManyBody().strength(-300))
    .force('center', d3.forceCenter(width/2, height/2))
    .force('collision', d3.forceCollide(30));

  const links = svg.append('g')
    .selectAll('line').data(edges).join('line')
    .attr('stroke', '#1e2733');

  const circles = svg.append('g')
    .selectAll('circle').data(nodes).join('circle')
    .attr('r', d => d.weight * 3 + 5)
    .attr('fill', d => d.color || '#00f0ff');

  simulation.on('tick', () => {
    links.attr('x1',d=>d.source.x).attr('y1',d=>d.source.y)
         .attr('x2',d=>d.target.x).attr('y2',d=>d.target.y);
    circles.attr('cx',d=>d.x).attr('cy',d=>d.y);
  });
}
from fastapi import APIRouter
from .database import db
from .models import Node, Edge

router = APIRouter(prefix="/api/graph")

@router.get("/")
async def get_graph():
    return {
        "nodes": await db.fetch_all("SELECT * FROM nodes"),
        "edges": await db.fetch_all("SELECT * FROM edges"),
    }

@router.post("/nodes")
async def create_node(node: Node):
    nid = await db.execute(
        "INSERT INTO nodes (label,tags,content) VALUES (?,?,?)",
        [node.label, node.tags, node.content])
    return {"id": nid, **node.dict()}

@router.post("/edges")
async def create_edge(edge: Edge):
    await db.execute(
        "INSERT INTO edges (source,target,label) VALUES (?,?,?)",
        [edge.source, edge.target, edge.label])
    return {"status": "linked"}